One page per client. Built for the renewal.
Every feature below is on the scorecard. Each one answers a different question your renewal conversation needs.
Capture the quote. Grade the reality.
At contract sign-off, log the activity profile each client promised — orders/month, picks/order, storage type, SKU mix, payment terms. Scorecard grades the live actuals against it every month. Amber flags when reality drifts. Red flags when it’s structurally wrong.
The renewal conversation stops being a vibe-check. It becomes a printed page showing what was promised and what actually happened.
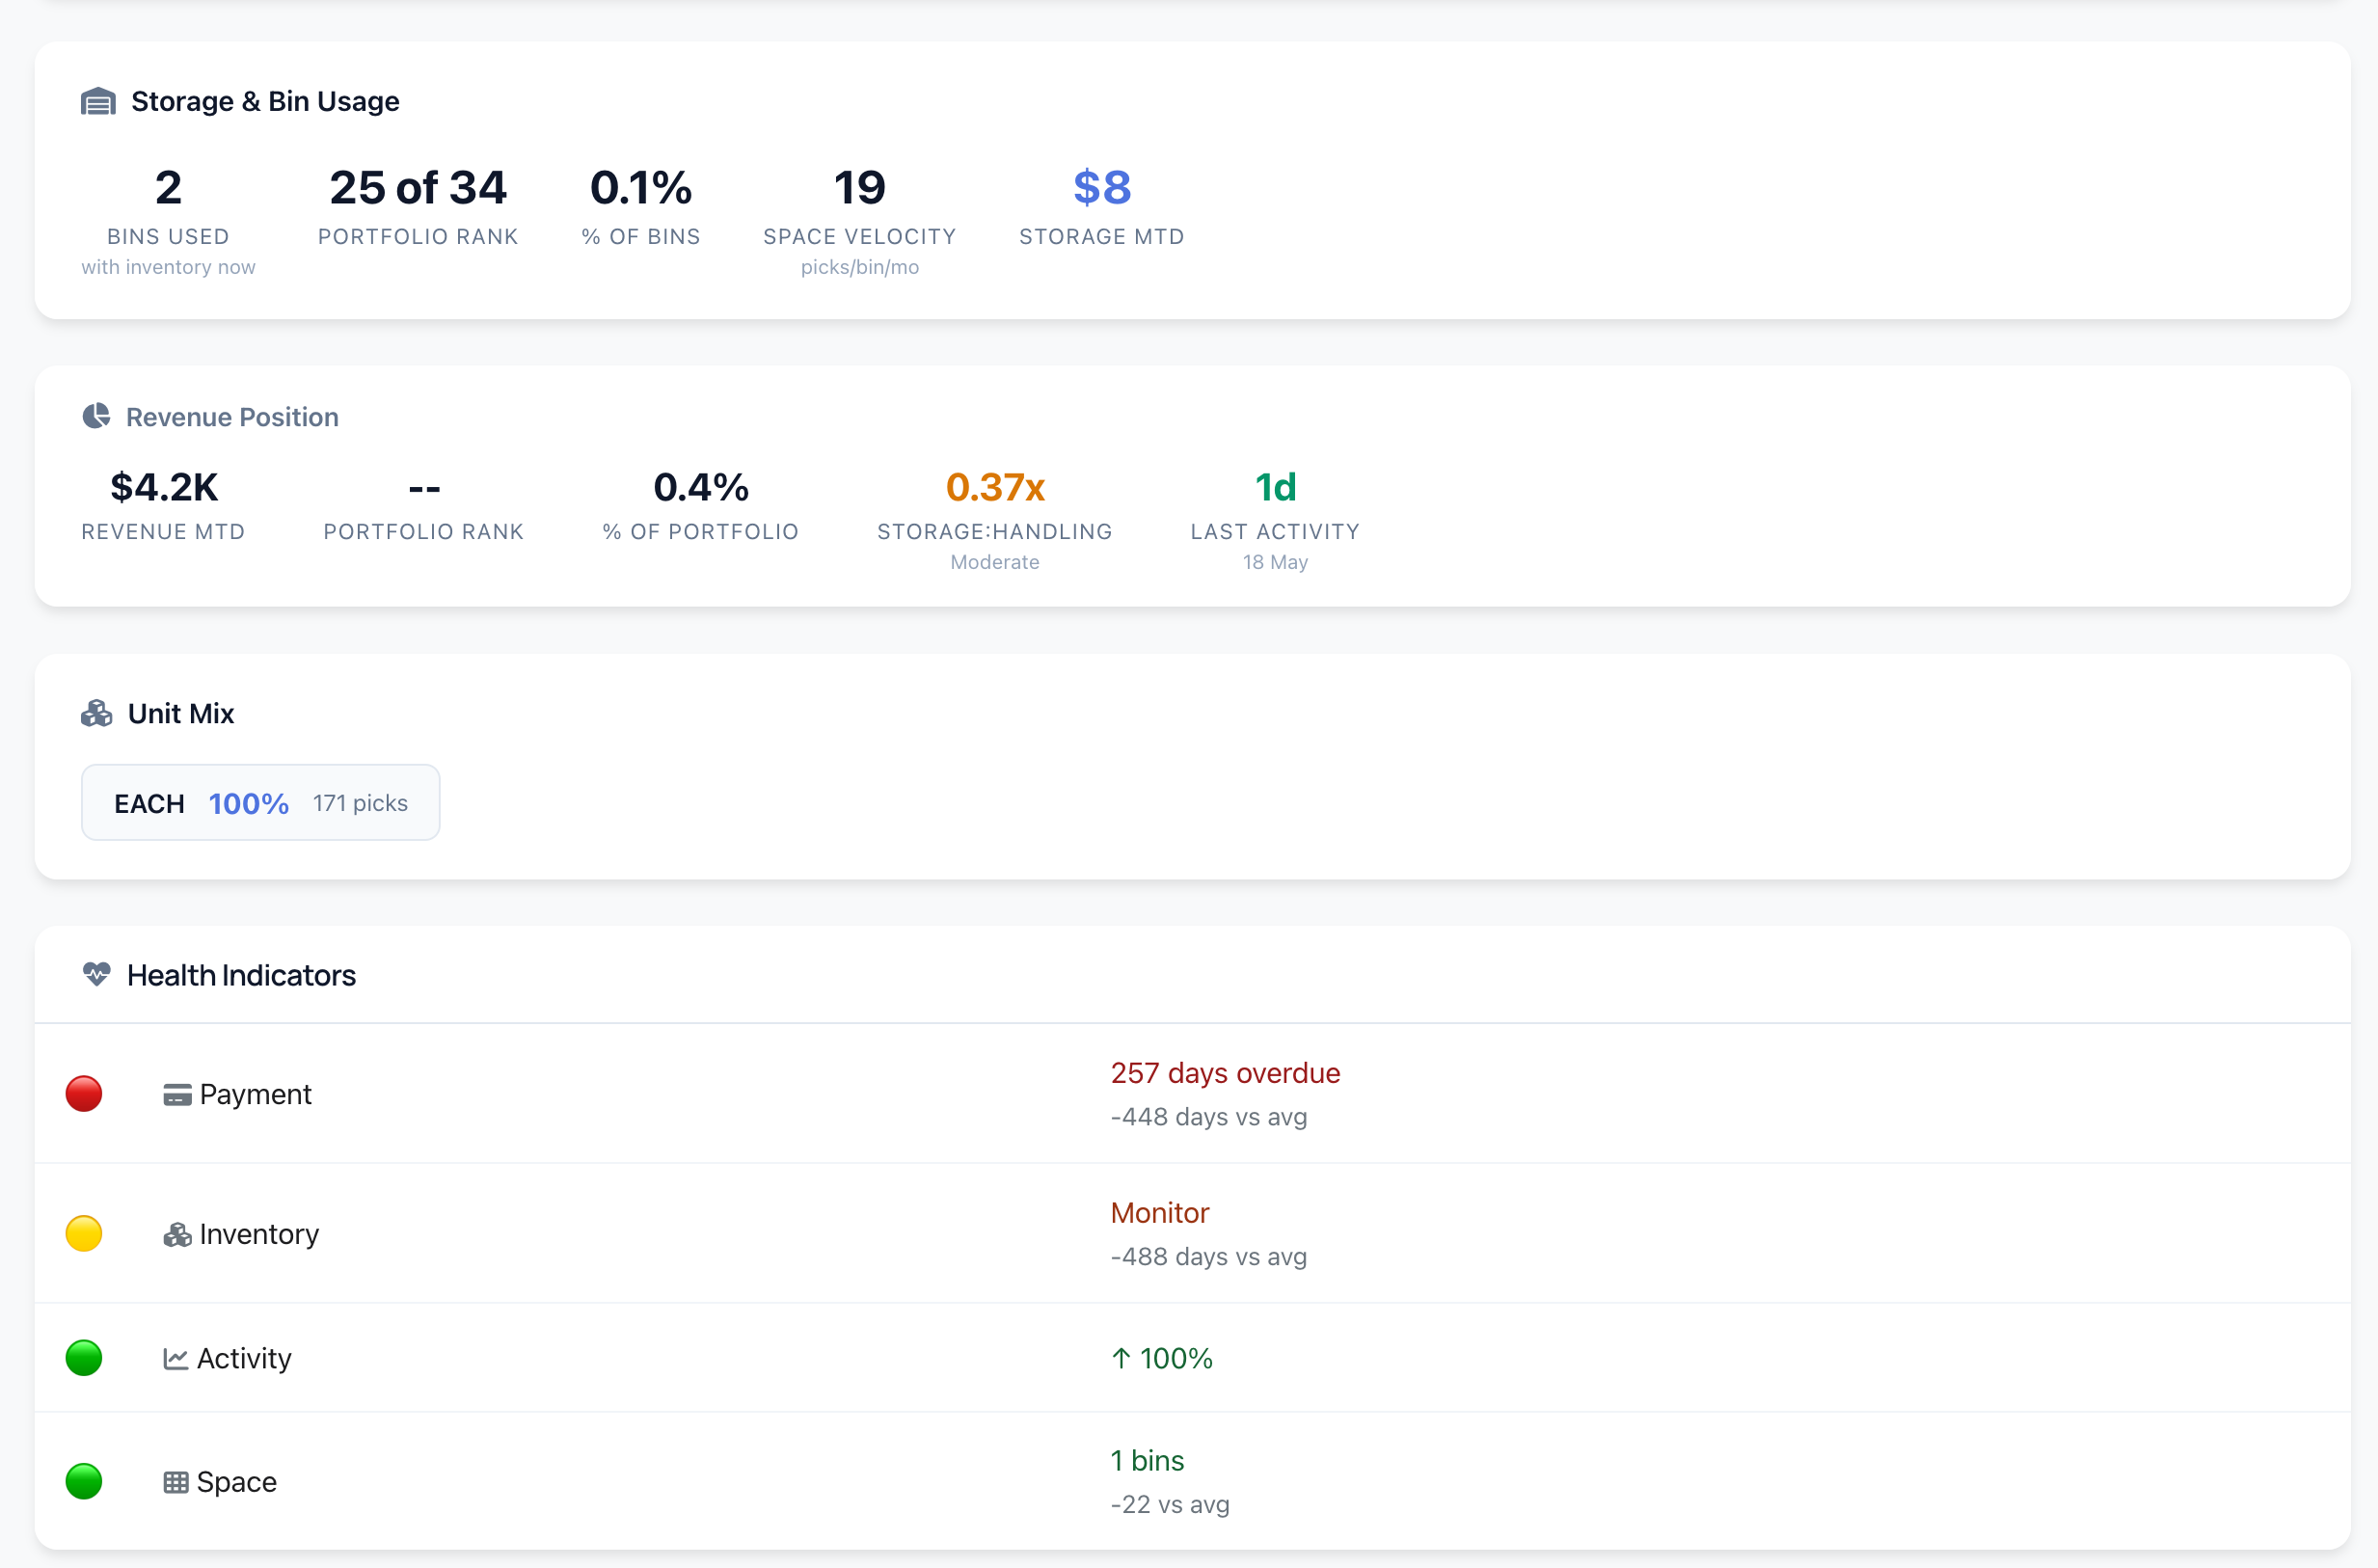
Six gauges, benchmarked to your warehouse.
Payment, inventory, activity, space, slow movers, revenue trend — each compared to your warehouse’s own averages, not somebody else’s industry blog post. Amber and red are the next-quarter agenda.
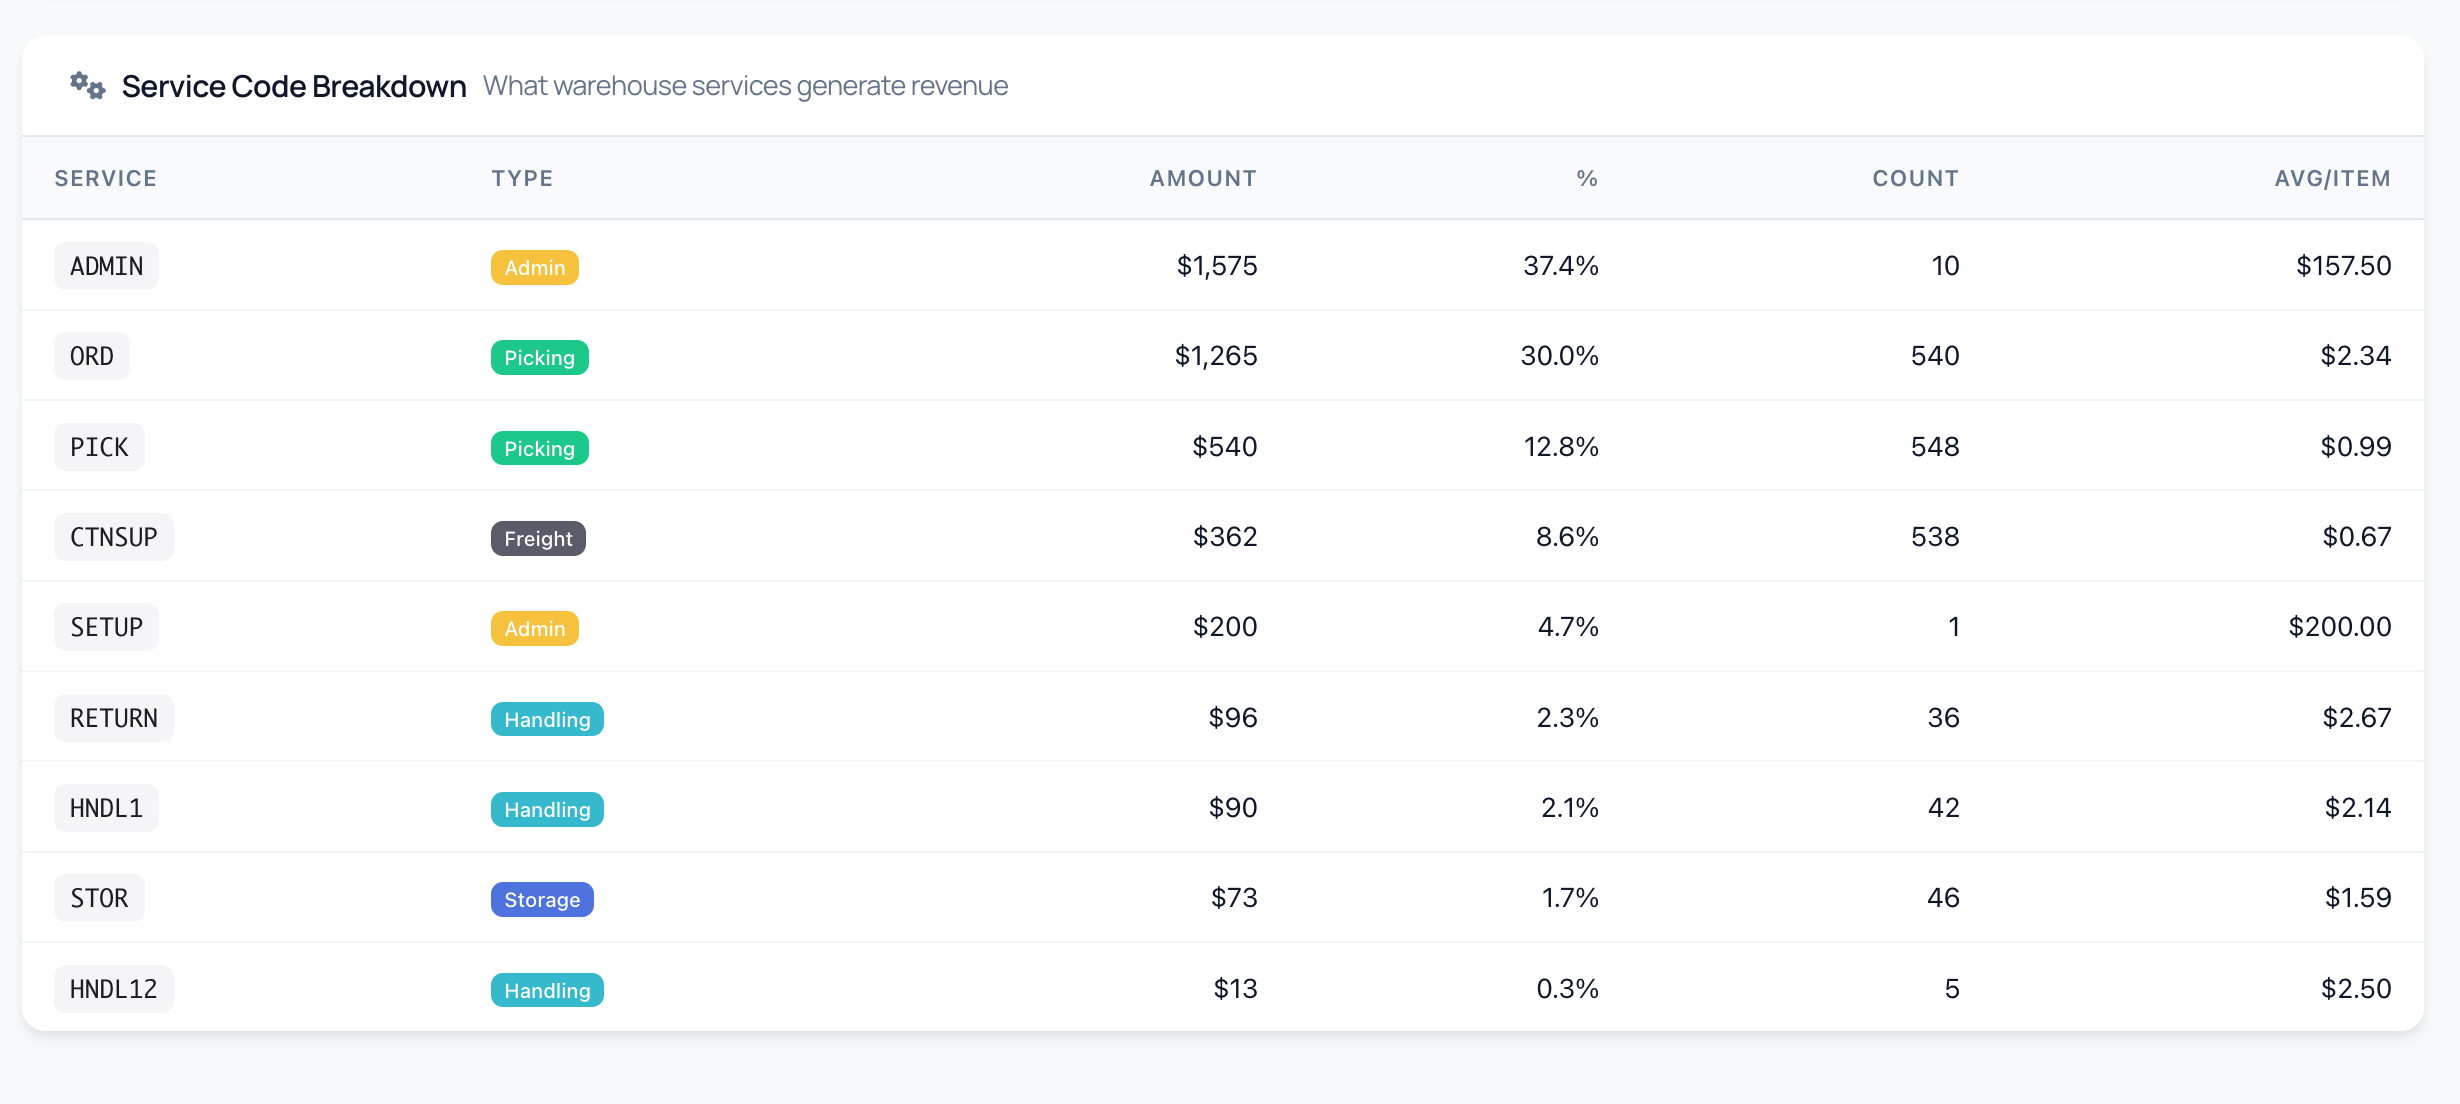
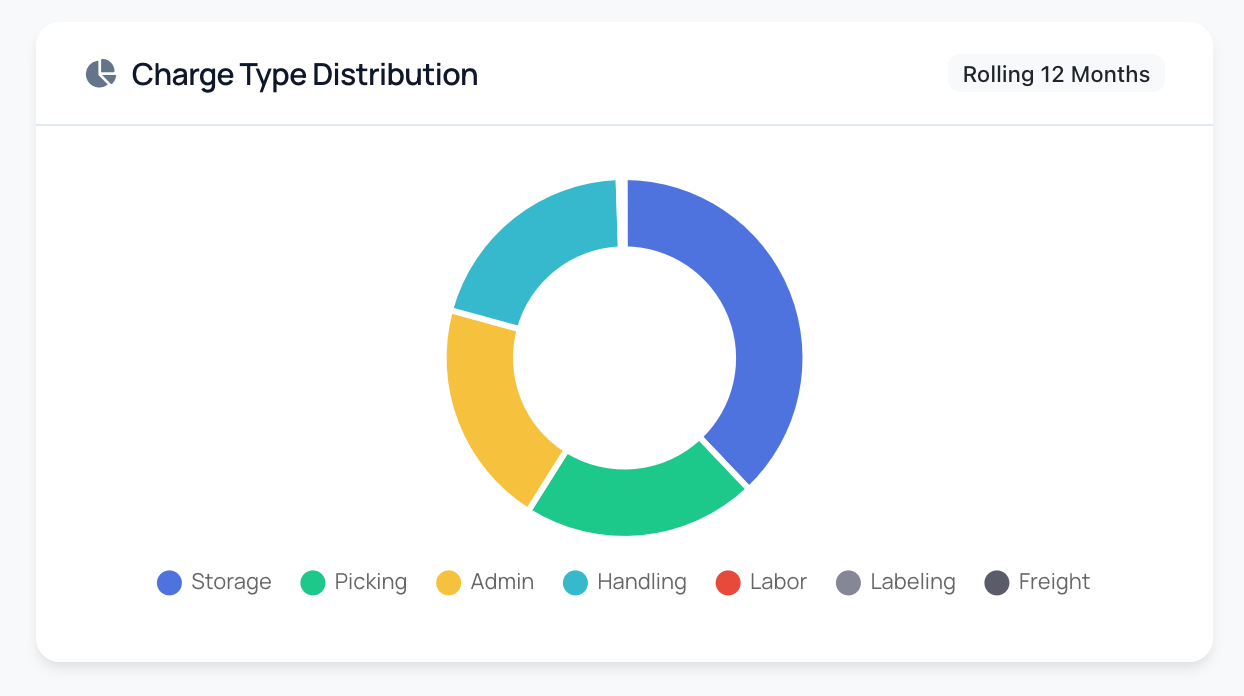
See exactly what each client is paying for.
Storage, picking, handling, admin, labour, labelling, freight, supplies — broken down per client. Is this a storage-heavy long-tail client? A pick-heavy fast-mover? A service-heavy account? The donut tells you in two seconds.
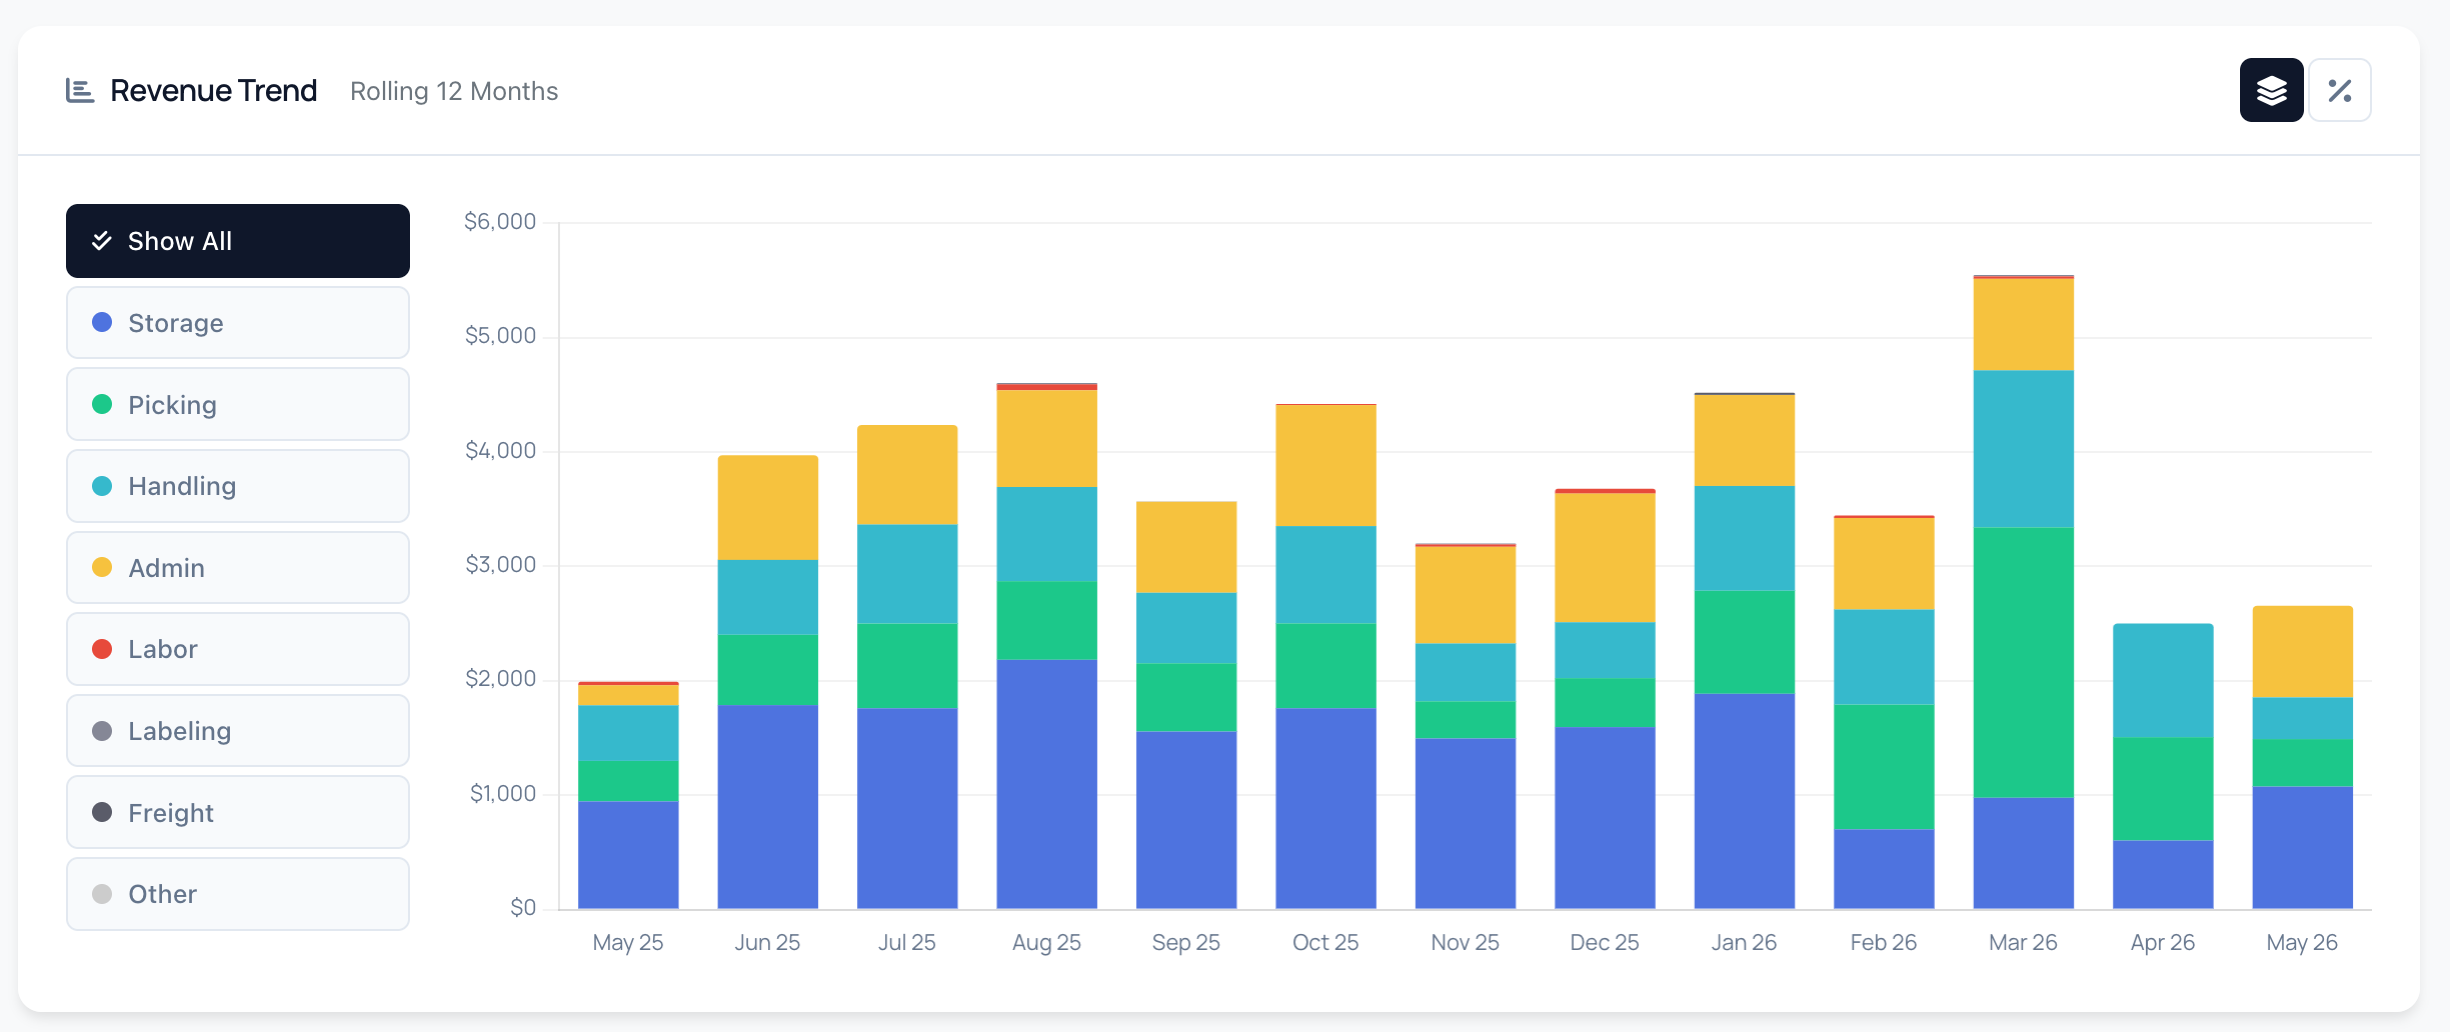
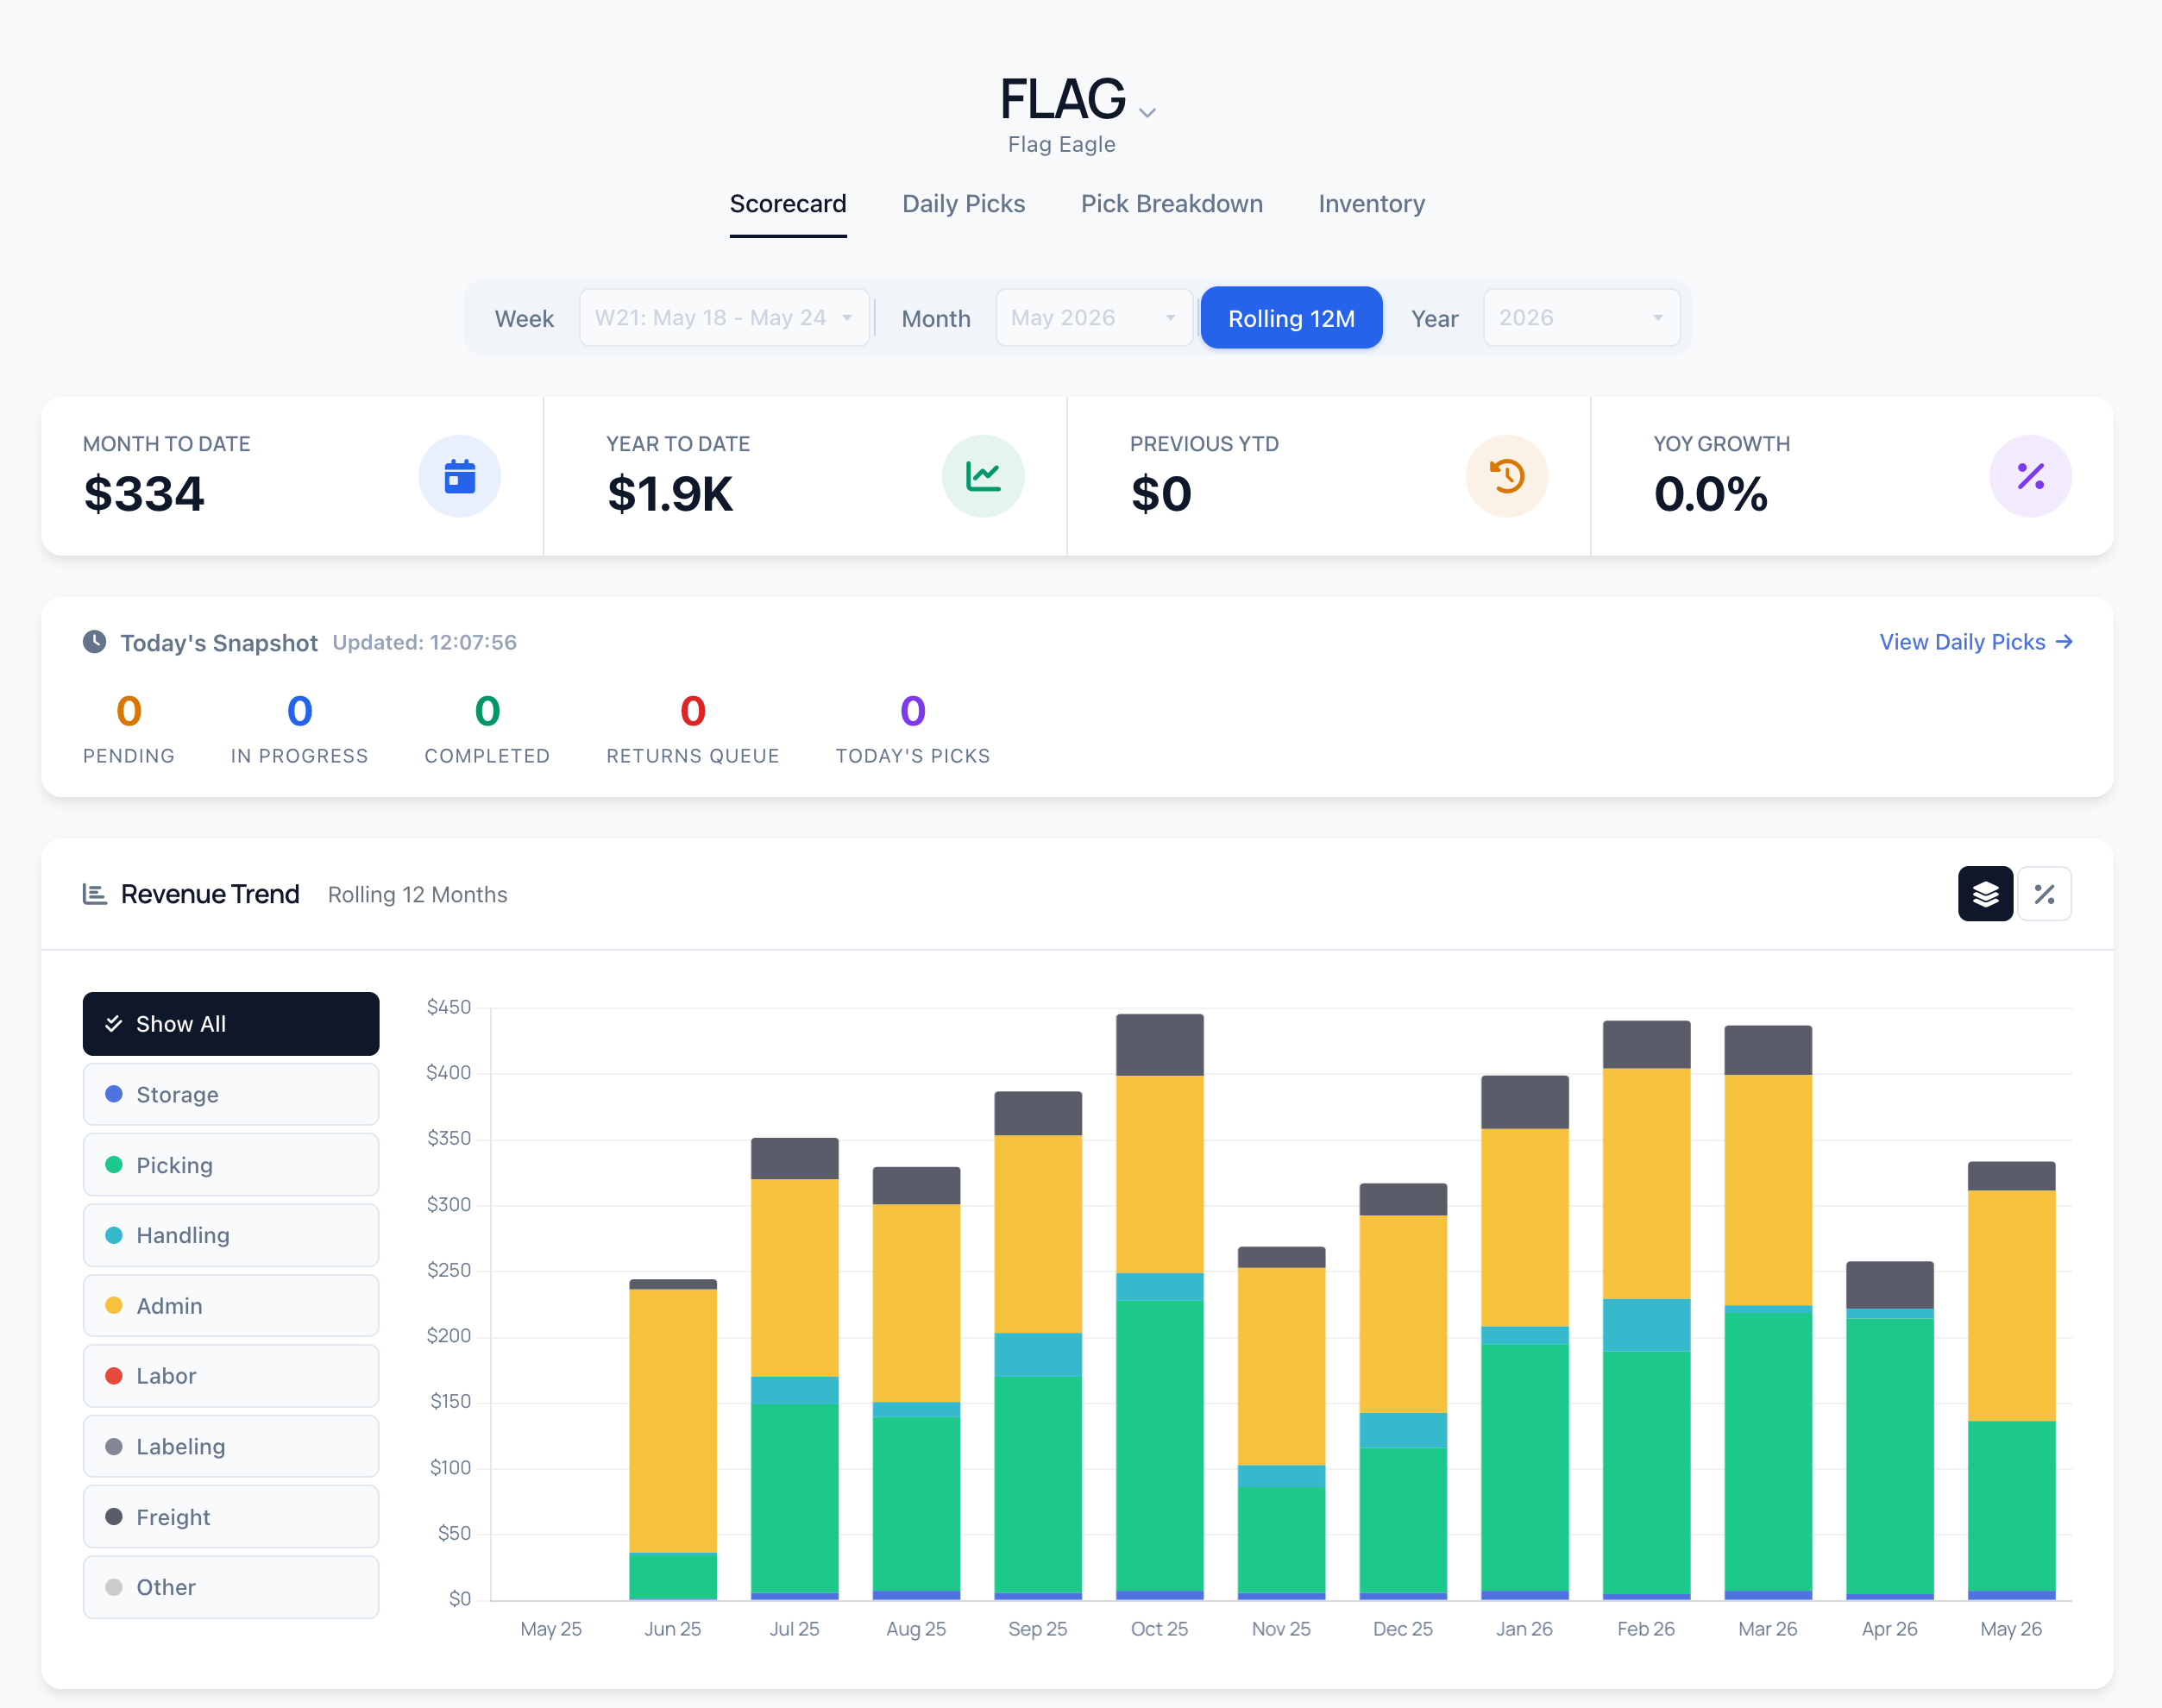
12 months of revenue. Where the money comes from.
Stacked bars by charge type. Toggle to percentage view to see mix drift — storage share creeping up while picking flatlines is the classic shelf-hostage signal. Filter to any single charge category with one click.
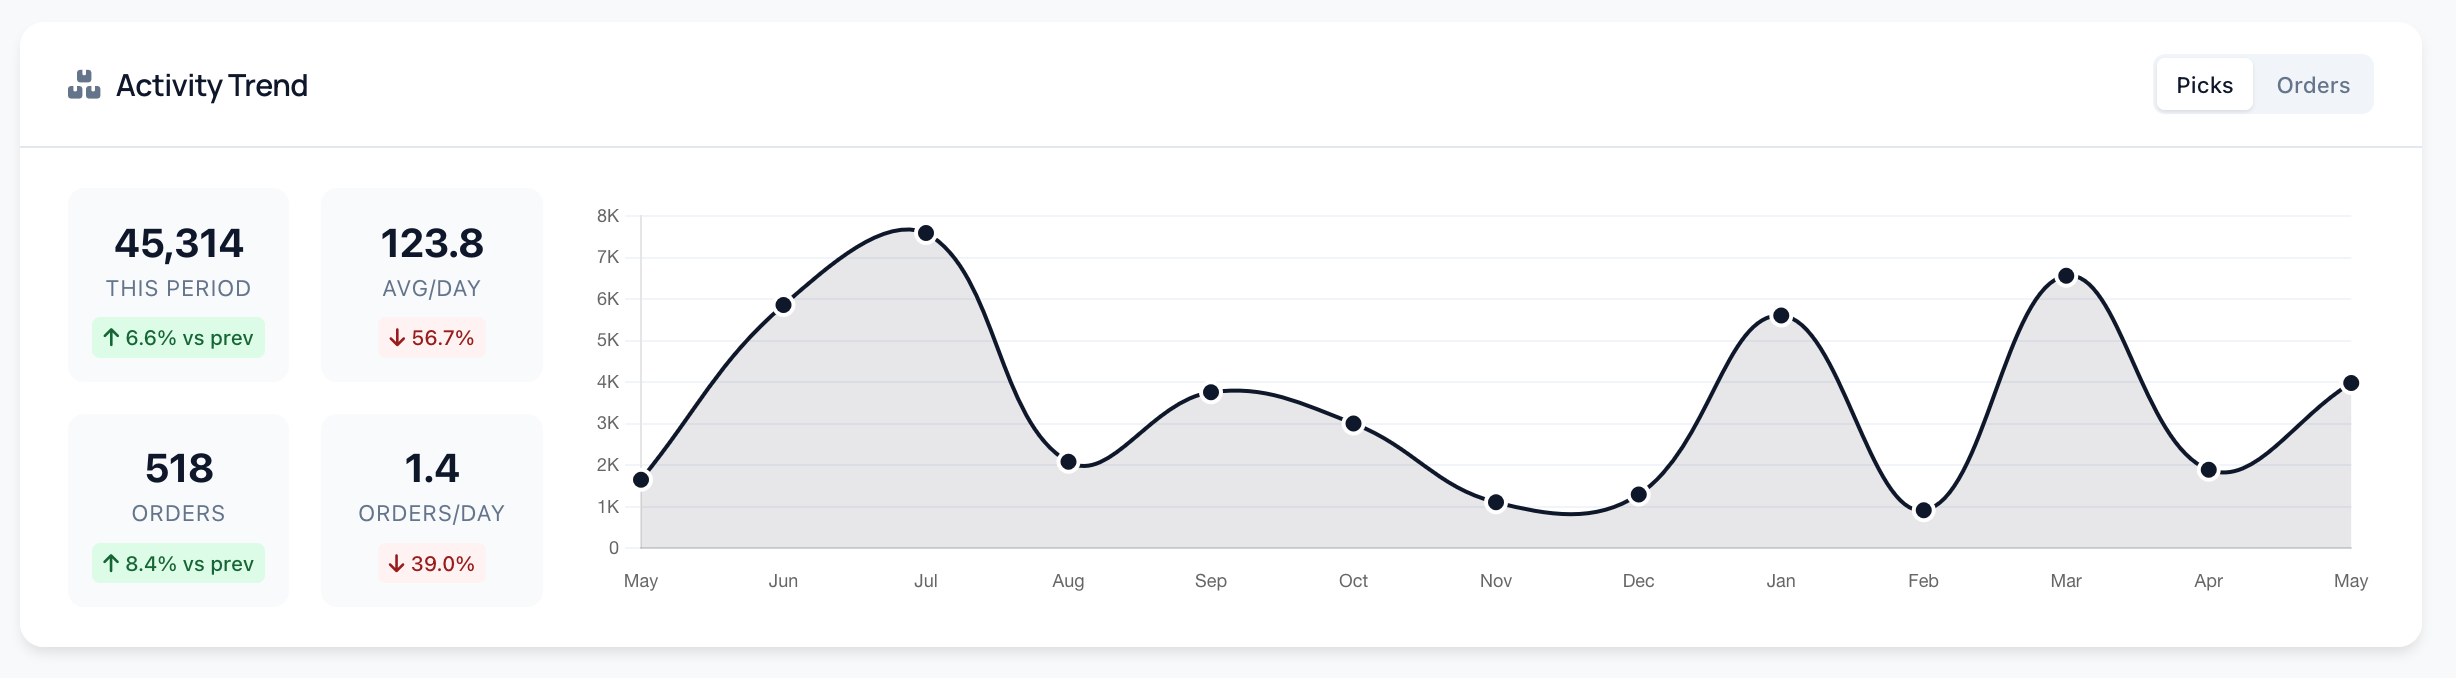
Picks and orders, side by side over 12 months.
Toggle between pick volume and order volume. Compare this to the activity profile the client promised at the quote. That gap is the renewal conversation.
Camelot direct. Other WMS on request.
Camelot users plug in directly with zero custom development — billing lines, picks, receipts and inventory flow in automatically.
On a different WMS? Start today by uploading CSV or Excel. Like the rest of the Warehouse Bridge family, we’ll scope direct connectors on request — HighJump, Synapse, Manhattan, Shopify, NetSuite, custom OData.
We configure your scorecard for you.
Send us your billing rate card, your charge code list, and a sample export. We map your data into the scorecard — charge categorisation, benchmark thresholds, the quote-capture template tailored to how you sell. No DIY setup wrestling.